nmrplot: a Python tool for plotting NMR spectra
Learning how to make a proper Python package
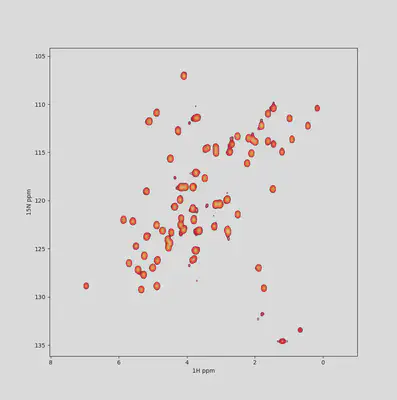
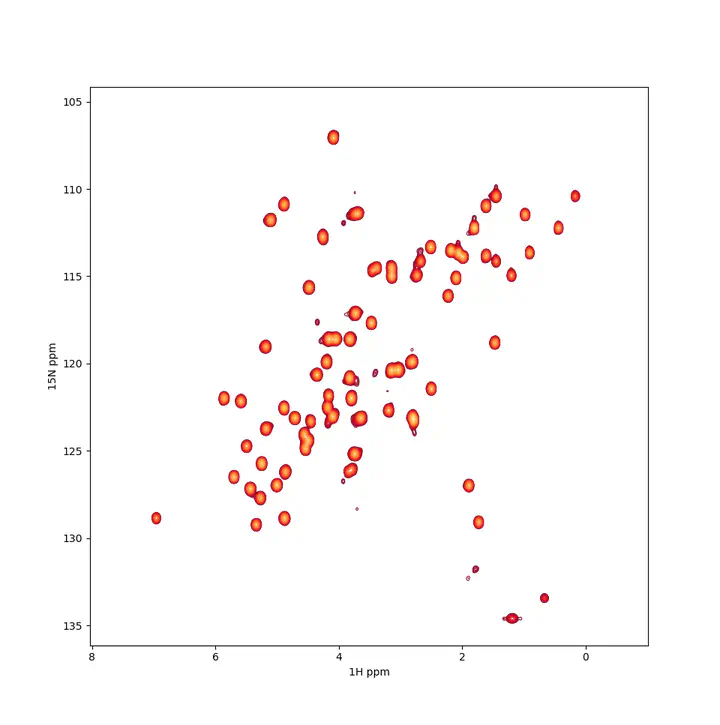 A $^{1}H-^{15}N$ spectrum example
TL;DR
nmrplot is a wrapper around nmrglue for plotting NMR spectra using
matplotlib. It is also the first proper Python package I make using my own
Cookiecutter template with testing, linting, CI, and documentation building.
Motivation
During the last couple of years I have been making extensive use of
nmrglue for loading NMR spectra into Jupyter
notebooks and preparing figures for presentations and reports.
nmrglue is a great tool for all NMR & Python aficionados: it can read, process and
write NMR spectra in most formats. Used with matplotlib, the resulting contour plots
are not only nicer than the standard exports from NMR-specific software, but also scriptable.
After consistently using a hacky code-dump module in different NMR research projects, I thought this would be a good opportunity to start a small Python project.
In parallel, I had also been learning some best practices in software development and
distribution. My use of version control, documentation and linting was quite lax, and I
had never implemented continuous integration. So after some research I put all these
parts in a custom
cookiecutter (post
to come about that) and started the nmrplot
project.
Goal
The goal of this tool is generating high quality, information-rich figures directly from processed NMR data. Additional data layers calculated on the fly can be easily implemented. Examples of such additional information include peak analysis — picking, integration, probabilistic assignment —, spectral analysis — signal-to-noise, referencing — or comparison between spectra.
nmrplot is limited to 1D and 2D spectra (or 2D slices of >= 3D spectra).
Support for other formats than Bruker — NMRPipe, Varian — should be
straightforward, as this is already possible in nmrglue . I guess that is a good
opportunity to learn how to use decorators.
Description and use cases
nmrplot is a module with a Command Line Interface (CLI) for direct interaction. The
CLI provides basic plotting capabilities from the terminal, while the Spectrum class
permits deeper interaction.
Usage from the command line
The CLI is intended to provide quick visualization while navigating a data set. The default parameters are set so running
nmrplot EXPERIMENT_PATH/EXPNO
should give a reasonably good contour plot. The default matplotlib QT backend enables panning, zooming and saving in various formats, among other basic options.
Plotting parameters can be easily tuned by passing options described in the help menu:
nmrplot --help

Usage: nmrplot [OPTIONS] PATH

  Plot a 1D or 2D Bruker NMR spectrum in a given path

Options:
  -p, --pdata TEXT       Number of processing in the Bruker experiment
  -t, --threshold FLOAT  How many times the noise level is the lowest contour
                         above the baseline
  -c, --cmap TEXT        The colormap to use. Options are: viridis, red, blue,
                         green, purple, orange, grey, light_red, light_blue.
                         Only with sign=both: coolwarm
  -n, --nlevs INTEGER    Number of contour levels to draw
  -f, --factor FLOAT     Increment factor between contour levels
  -s, --sign TEXT        Whether to draw positive, negative or both contours.
                         Options are: positive, negative, both
  --help                 Show this message and exit.
I used click to generate this CLI. It is a very
convenient tool, as all the help interface is automatically generated from the
__main__.py.
This, along with the online documentation — also automatically parsed by mkdocstrings — provides the user with complete and handy information with little effort.
Usage in Jupyter notebooks and Python scripts
I find Jupyter notebooks are great environments for making figures and plots for papers and reports, from the initial exploratory stage to the publication stage. Plain scripts can provide the same functionality and are less conflictive with version control, so they are probably a better solution for long-term deposition.
Here is a notebook with an example plot using the Spectrum.plot_spectrum method, but one can also directly access Spectrum.data.
Advantages of nmrplot
Traceability and reproducibility
A notebook or script containing the paths to the data inputs and the figure outputs is a traceable and self-contained solution, perfect for scientific communications. Raw data, processed outputs and analysis can be easily shared with collaborators or made public.
As a task gets more complex than simple on-the-fly analysis, refactoring the code in a separate module and adding environment requirements and dependencies also enforces reproducibility.
Composability
matplotlib is the de facto standard Python library for
plotting. It will get the job done for users of any level in most cases, so with a few
visits to Stackoverflow, one can compose complex publication
figures with multiple subplots, insets, etc.
There also tools in the Python environment that enable interactive plots, like
bokeh or
plotly. Such format can be interesting for academic researchers
in the context of collaboration of dissemination.
Beautiful plots
Most specialized NMR data analysis software I know lack love on the aesthetical side. Nice modern color maps, fonts, alpha compositing, contour level thickness ar little things that can make the difference between a dull plot and a pleasing figure for your presentations and papers.
Also, exporting options are totally customizable: format, size, resolution… Write the settings once, update all figures whenever you want!
How to install nmrplot
nmrplot can be installed using pip from the command line directly from GitHub:
python -m pip install git+https://github.com/miguelarbesu/nmrplot
Insiders can install an editable dev copy by cloning or forking the repository and running
python -m pip install -e .