Plotting reference Chemical Shifts with Bokeh
Interactive charts for the BMRB reference chemical shifts
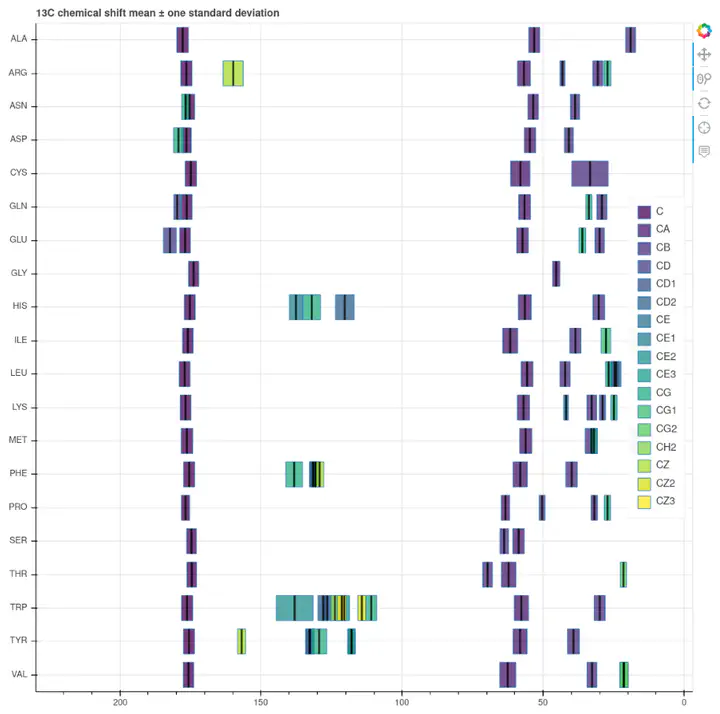 $^{13}C$ reference chemical shifts
TL;DR
I made my own plots from the BMRB chemical shift reference data set. They are interactive and accessible on the web using GitHub Pages.
You can check them here:
The chemical shift
The Chemical Shift, $(\delta)$ is one of the basic magnitudes in Nuclear Magnetic Resonance (NMR). It represents the frequency at which a nuclear spin precesses under a magnetic field, referenced versus an arbitrary standard signal. It is expressed in ppm (parts per million). In biomolecular NMR chemical shifts provide a great wealth of structural information, even allowing us to model the overall conformation of a protein de novo.
In short, the chemical shift is a sort of NMR coordinate for each $^{1}H$, $^{13}C$ and $^{15}N$ atom in a given protein. The approximate ranges here are 0 - 12 ppm for $^{1}H$; 0 - 200 for $^{13}C$ and 30 - 230 for $^{15}N$ atoms. The actual value depends in the first place on the chemical identity of the atom – i.e. what other atoms does it associate with. For example, methyl groups tend to cluster in the low end of the $^{1}H$ and $^{13}C$ scales. On the other side, $^{13}C$ atoms in carbonyl groups always lay beyond 150 ppm.
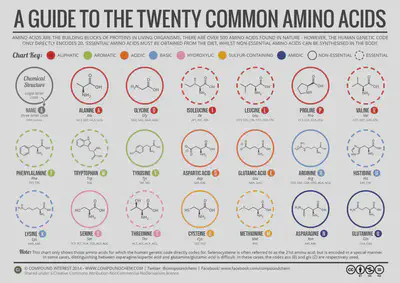
Protein chemical shifts: amino acids and structure
The usual 20 amino acids in the table below make most proteins, assembling linearly via peptide bonds. All of them contain (mostly) H, C and N atoms. So when we do biomolecular NMR the peaks in our spectra are some combination derived from a basic set of chemical shifts.
The amino acid identity further determines the chemical shift of its atoms. The different side chains tune the particular shift ranges for each atom to some extent. Next, we have the effect of the local environment of the amino acid. The particular sequence in which an amino acid is embedded – i.e. its neighbors – and the spatial arrangement they adopt (forming helices, strands, or other shapes). Finally, this supra-structural elements also interact between themselves and further organize in space, affecting chemical shifts as well.
In all, protein chemical shifts are initially determined by the chemical properties and further tuned by structure. Not all atoms are sensitive to the same structural features, so some show very wide spreads while others have rather narrow distributions. The distributions are normal-ish, so an average value and a standard deviation is in general an acceptable reference. Extreme values are rare and often associated with particular structural features.
Reference chemical shift statistics: the BMRB data base
The Biomolecular Magnetic Resonance Bank (BMRB) is one of those great collaborative efforts that help building research. This open access database is the main deposition site for biomolecular NMR data, and includes chemical shifts from over 11,500 samples. The BMRB staff also curates a collection of amino acid chemical shift statistics, an extremely useful resource. Their filtered reference set is available in HTML or CSV formats. This 280 row table contains averages, maxima, minima, and standard deviations for each H, C and N atom of each amino acid. This page is arguably the most commonly visited site from any computer connected to a spectrometer. When we stare at a new spectrum, for example a 2D $^{13}C-^{13}C$ correlation, it is useful to identify some specific amino acid cross peak by checking the corresponding average chemical shifts and ranges.
The tabular format however requires a lot of scrolling back and forth for some of these standard tasks, so the BMRB also offers a collection of chemical shift histograms and densities for each amino acid (more abut this later). However, one often would like to discern between possible amino acid identities by comparing their distributions side by side.
My own visualization of the BMRB filtered data set
My ideal visualization of the BMRB data set would
- Display all amino acids at once, one atom kind at a time.
- Be interactive: panning and zooming, lookup of values on hover.
- Handy: web access is preferred 1.
Fetching and processing the data
At the time of making these plots I was also reading a lot about DAGs and Makefiles, so here I experimented a bit with Snakemake. This tool facilitates writing workflows for fetching, processing and plotting data in Python. Without entering in details, the Snakefile contains recipes for
- fetching the BMRB data set
- fixing some atom names
- calculating the average $\pm$ 1*standard deviation limits
- splitting it in H, C and N atoms
- generating plots from each in HTML format
With Snakemake, one can quickly make changes in any of the steps and re-run the pipeline only from the modified stage on.
Interactive plots with Bokeh
Bokeh is a Python library for data visualization with a strong emphasis on interactivity and shareability. As you can see in this short tutorial it is very easy to create actionable charts from your data. Ideally I would like horizontal violin plots representing the respective chemical shift distributions. This data is available somewhere else (see below), but as a quick approximation I used horizontal bars indicating the average value, $\pm$ one standard deviation. As mentioned above I had split the original dataset in H, C and N chemical shifts, so I made three charts, one for each atom type. You can find them here.
Defining some basic level of interactivity is very simple in Bokeh. I enabled zooming and panning, and information display on hover (average, standard deviation, maximum and minimum).
There are also many options to embed your plots in dashboards or notebooks. In this case, I decided to generate static HTML files I could host on my website 2
Web hosting with GitHub pages
GitHub pages is a great way to give your projects a public face, and it’s very simple: Sign up on GitHub, push your project, go to Preferences and enable GitHub pages. By default, the README file will immediately become a website3, just like that! . A couple of links to the HTML Bokeh charts and the interactive plots are available online.
Future improvements
Color palette
One problem about the design is the poor performance of any of the default color scales I tested, as there are too many atom classes. A categorical color map should work best here, but there is also some structure to the collection: the nomenclature goes in alphabetical order from the amino acid head to the side chain tail. In the end I went with the sequential viridis, but I am not totally happy with the result. This calls for a custom palette.
Range overlap
Some chemical shift ranges overlap in many amino acids, specially in the case of H atoms. Bokeh charts allow graying out by clicking on the legend, but not in multi-line plots as this one (yet).
Bars do not show the real distribution
Even if the given averages and ranges are useful, it would be much nicer to show the real chemical shift distribution for each atom. Violin plots could work nicely here. However, for that we need to compute the distributions from the whole BMRB data set, not the summary I used here. Fortunately, the raw data is available to do so:
From the BMRB team: R package and REST API
The BRMR team has done a remarkable effort to have and open source public interface. On the one hand, they released the R package they used for generating their plots. It is built on top of an API for programmatically querying the database. It should not be too difficult to fetch the data and calculate the distributions using Python.
Due to a mix of technical reasons and animistic beliefs, spectrometer computers often run outdated CentOS systems where the operator is not allowed to install or update libraries. ↩︎
Update 2022-03-22: Embedding was straightforward in my previous Jekyll website (the framework used by GitHub pages). In my new Hugo-powered website it is possible to embed interactive Bokeh charts saven in JSON format using shortcodes. ↩︎
Actually a pretty decent one just using default themes ↩︎